An engineering leader who works on the business understands how their team works. They understand their team collaboration dynamics and code reviews. They visualize trends in work patterns over time and recognize achievements that otherwise would be invisible. They identify coaching opportunities that elevate their team as a whole.
They use this data to push information up and raise visibility across the organization around how hard engineering is working, in a way that makes sense to the leadership that does not see the ground truth. By visualizing the full delivery process from idea to production, looking not only at what was built but also how it was built, they can spot bottlenecks or process issues that, when cleared, increase the overall health and capacity of the team.
Measurable insights
Well developed qualitative analysis, senses, and gut feelings of the health of your team’s development have brought software engineering a long way, and with the advent of a new age of robust qualitative analysis at the fingertips, it is our responsibility as engineering leaders to turn those gut feelings, and what healthy development looks like, into repeatable, measurable, quantitative insights that we can leverage to help our team deliver the best work and thrive.
A common conversation in one-on-ones between managers and directors is to discuss what the team is working on and how they’re delivering relative to expectations. ‘How’s the team doing? What are they focusing on? How has additional headcount or process changes affected the team’s outputs?’ Those are all questions you might discuss from time to time. ‘Then what can we expect from the team moving forward?’ The overarching themes here are: ‘Is the team working on projects that are perceived as valuable, and how are they progressing relative to expectations?’ To answer the question of how the team is doing, you need to start by knowing what the team is spending their time on. You know, the release that they’re on and the goals of the sprint. But, do you know how much of each engineer’s time is being spent on New Work, Legacy Refactoring, Help Others or Churn?
Git Analytics tools, such as Waydev or Gitprime, provide engineering leaders with high-level engineering reports to assist them in making data-driven decisions.
Understanding the work focus
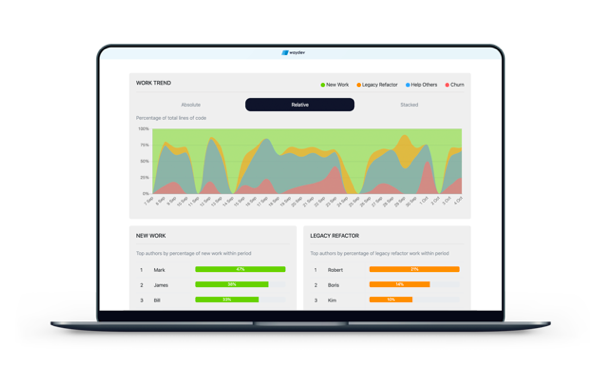
If your team is more focused on releasing new products or features, you’d probably expect around half of the work delivered or more to be New Work. Other engineering teams might be spending more time on Legacy Refactoring, which is defined as code that updates or edits at least 21-days old code. Legacy Refactoring is the process of paying down technical debt, which is traditionally more challenging to see.
New feature development frequently implies the reworking of old code, but these activities are often not as clear until you’re actually working in the codebase. You might include it in the scope of a project before you begin. Other times, the team might decide to focus an entire sprint or more on paying down technical debt, and this Legacy Refactoring is probably essential foundational work. Your business may not be able to achieve its goals in the next fiscal quarter if your team doesn’t refactor old code.
That said, since it’s more difficult to see and is less flashy than shipping new features, it can be harder to get buy-in for spending time on such projects. You have to help senior leaders see that time spent strategically on Legacy Refactoring this month can make it easier to ship New Work next month and going forward, but first, you have to show them where your team is spending their time. To help you and your manager both see what your team is working on, especially compared to what the business goals are for new features this quarter and the larger releases next year, you’ll want to refer to the Project Timeline.
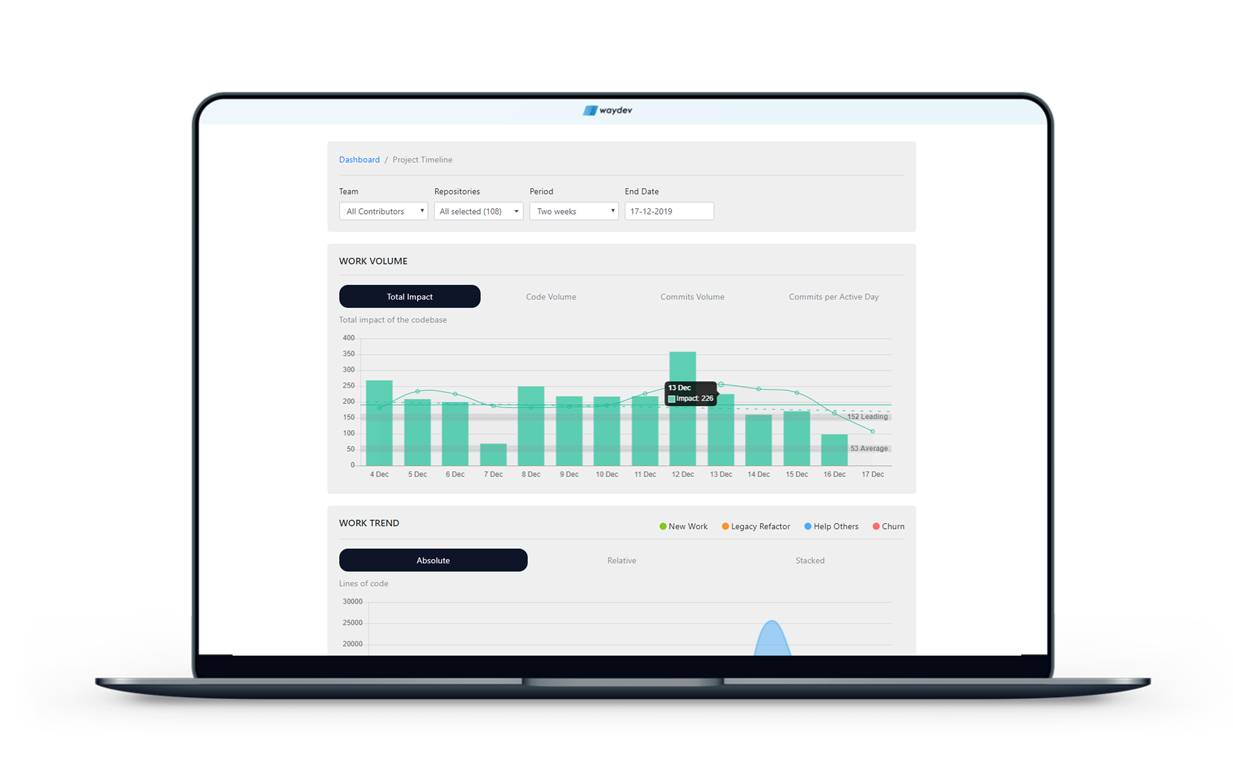
The Project Timeline shows you aggregate outputs. With it, you can see progress trends for the team, which can act a lot like a highlight reel. You can also show how much time is spent writing new code versus paying down technical debt.
Correlate to real-life events
Let’s say that a batch of new hires joined. Start with visualizing what the team is spending their time on. Here you can see the four work types. You can also see the time period in which the work was done, the total lines of code for each work type, and a list of your team members under each work type and which contributors contributed the most of each type of work focus. When you look at this data, you may want to filter to view a specific release cycle for the team. Is what you’re seeing aligned with what you’d expect to see relative to prior periods and with the context of the team’s current priorities? Is what they’re primarily focusing on in line with the business objectives? When the team is focused on reworking older areas of the code base in order to pave the way for future releases, you can anticipate that senior leaders or external stakeholders may be curious as to what the engineering team is focusing on, since this type of work is not as visible to them.
If you change the code base output view from commit volume to total impact, you can say that actual impact to the code base is similar to the rest of the department, but what you can notice is that a lot of the department is focused on releasing new features, while another team is focused on cleaning up the code base for the rest of the department to benefit from. This doesn’t necessarily translate immediately into new features, but it makes it possible for our team and other teams to build better features faster. Without this work, those new features simply would not be possible. Use these data points to help explain how your work on re-platforming your codebase will benefit the business moving forward.

On the other hand, if the product roadmap calls for new features to be developed in the near future, but you’re clearly already in the midst of important refactoring, or your team is already stretched them, you may be able to leverage this data to make a case for adding additional resources or headcount, or adjust expectations and delivery dates to relieve the team. Data like this makes the invisible work your team does visible to the people who need to understand it – decision makers, executives, people who are responsible for approving budgets for new headcount. Without data, engineering doesn’t get the recognition that other departments often get, and invisible work like Legacy Refactoring is a difficult communication gap to bridge. Use the reports in the Project Timeline to create visibility around what engineering is working on, and regularly push that information up and out.
Solidify your narratives
To improve your chances of getting additional resources, use data to build a before and after case for resource allocation. Data can also help you solidify your narrative, tell your team’s story and broaden that story over time, so your manager understands why you’re asking for resources, and how those resources will help the engineering team deliver items that contribute to the businesses objectives. The metrics that are most commonly used in these scenarios are Impact and Efficiency. Impact helps you speak towards the complexity of output into the product, while Efficiency speaks towards the survivability of that output.
Let’s start with a common difficult scenario to handle as a manager. During a trying quarter this year for your business, or because of a shift in business strategy, the decision was made to retract budget from your team, and you weren’t able to make the additional hires that you’d planned on adding. Your team needed a few new engineers with some rather specific skillsets in order to complete the product demands the business was asking of you. Without the hires, your team was asked to work in areas that pushed beyond their expertise and both the team’s morale and the team’s ability to execute suffered. But now it’s a quarter or two later and the business demands of your team to continue to grow, and you’re ready to ask for that additional headcount again, but you don’t just want to go to your director and try to rely on persuasion for new hires.
Look at the team’s Impact for the quarter, following the misalignment between your team’s skillsets and the skill sets required for you to deliver appropriately. If you notice a steep decline in your team’s impact, that is strong proof that the hunches about the deficit and skills and the business requirements at hand were affecting your team’s ability to hit key milestones in getting our customers the software they need.
Bring the visualizations into your next headcount planning meeting and showcase to your leader that in order for you to deliver the products your customers need, your team needs to hire for that role that can fill these critical skill gaps and reverse the abrupt trend you see after the decision was made to retract your hiring plans earlier in the year. Measure any fluctuations in the team’s output following that event in order to help bring the team back to the output it had before, at least one engineer will need to be hired.
When you can provide visualizations like these that are easy to understand, even for leaders who are far removed or nontechnical, it’s much easier to align your team’s needs with the business objectives and ensure your team is set up for success to deliver. So now that you’ve hired this individual and they’re successfully ramping up, it’s time to close the loop and demonstrate to your leadership the positive effect that this hire is having for your team. You can use impact and efficiency together to help tell this narrative. As a brief reminder, the impact is the complexity of output, whereas efficiency is the survivability of that output. So, let’s say you see that the impact score went up 11% when you made the hire and efficiency for that same period stayed flat. What this indicates is that the increase in impact thanks to that new hire is a real change in output.
Showcasing success
You can then tell your manager or executives that past hires were effective, allowing your team to do better work. When the data shows that the impact of business decisions or additions of engineers or resources directly impact the team’s health and productivity, you help your senior leadership make more informed decisions about the health of their team’s development. If you are able to make the case to have a budget allocated to resource your needs, your objective will then be to show senior leaders that they made the right decision. That is, after hiring a new engineer, you’ll want to measure the raw aggregate daily impact for your team in the Project Timeline. How did that hire impact your scores? How is it impacting the code base, the product, and the team? By keeping your senior leaders looped in on how investments in engineers directly lead to improvements in outputs, you’re always making a case for maintaining your team and growing it to support every major initiative.

