Whether you’re leading two engineers or multiple teams of engineers, there may have been a time you wondered about this when sitting in a one-on-one. “Is this 30-minute meeting actually useful for this person? Is it time well spent?” To date, maybe you’ve used one-on-ones as a time to build rapport, discuss specific reports, or mentor the individual on a particular challenge that they’re facing, or maybe you’ve asked your report to guide the one on one by bringing a list of questions, concerns, and ideas to the meeting.
There’s one goal on that list that’s particularly important that engineering management doesn’t focus on: reviewing the historical outputs an individual has contributed to their team and mapping that to their impact on the team’s objectives and tying it back to expectations.
This creates a sense of clarity that can boost motivation amongst the team. Being clear and consistent with expectations, encouraging team members’ development, and recognizing good work these are elements of excellent management.
So how do you review an engineer’s historical outputs? A part of the job is quantitative review, finding what is going on exactly. The other part is qualitative, where the goal is to better understand the why behind the patterns and activities you’re seeing.
Git Analytics tools, such as Waydev, Gitprime vs Velocity, help engineering leaders review the historical output of their teams and map it to the impact on the team’s objectives.
We will teach you how to use the analytics regarding the development process to get the full picture of the what, so you can use that information to get to the why, and have more targeted conversations in one-on-ones. Ultimately, the metrics we’ll walk through should help you rely less on assumptions and hunches and be less susceptible to being swayed by unconscious biases. They should give you a starting point and a conduit to ask your team even better questions and have healthier and more productive discussions.
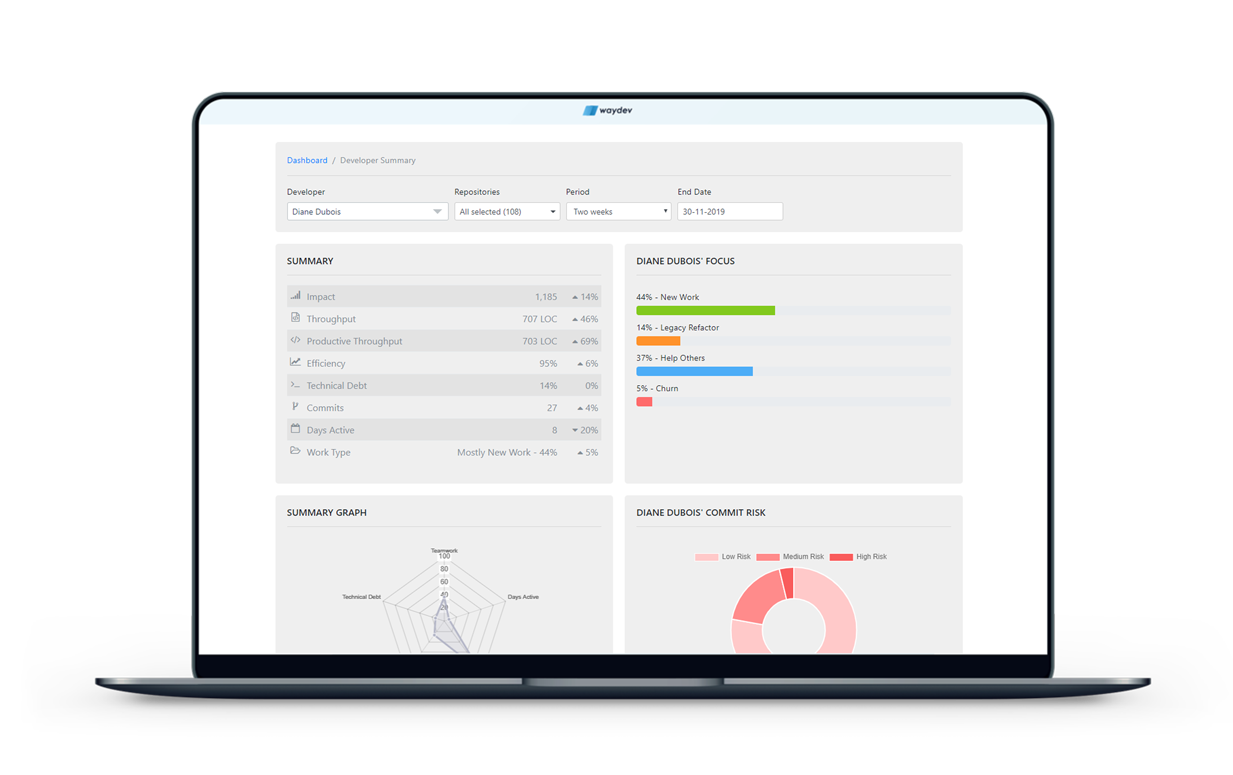
The Developer Summary was designed to support managers that wanted to easily pull up data to help inform even more actionable and specific one-on-ones and quarterly reviews. As you’ll see, the Developer Summary shows you a condensed view of an individual’s core metrics with trends and averages for an engineer’s metrics relative to those of their team. It includes a view of your engineer’s output, which is particularly useful to help you understand the shape of an engineer’s week or month across all work types.
The Developer Summary feature is proprietary to Waydev, but you can learn more about individual code metrics in a Gitprime vs Velocity and Waydev comparison.
You’ll get a stronger sense of how they perform in their code-level activities. Over time, this will help you and your team members visualize work patterns and progress over time, which can be useful information to drive conversations in one-on-ones.
With the Developer Summary, it’s now possible to have a better understanding of what’s going on before you enter a one-on-one so you can spend less time talking about what‘s going on and more time talking about why, which might shine a light on opportunities where you could help and when you’re advocating for a specific individual on your team, you can leverage trends from the Developer Summary to tell a more compelling, proven story.